
Services
Industries

Software Engineering
Cyber Security
IT Consulting
Artificial Intelligence
Progress OpenEdge
Cloud
Business Intelligence solutions enable organisations to shift from manual reporting to strategic analysis, transforming raw data into meaningful insights for faster decision-making and higher productivity.
This case study explores how Baltic Amadeus developed a data visualisation solution for Unipark, a Lithuanian parking provider, enabling clearer performance tracking and more efficient data management.
Unipark, a member of the Modus Group, provides short-term and long-term parking services across Lithuania, Latvia and Belarus. Operating in multiple markets, the company manages a significant volume of operational and performance data.
As data volumes increased, managing and interpreting information became increasingly complex. Existing performance indicator reports lacked visual clarity and failed to provide the insights needed for rapid, well-informed decision-making. The absence of strong visual cues limited the ability to quickly identify issues, detect trends, and generate deeper analytical insights.
To address these challenges, Baltic Amadeus was engaged to design and implement a comprehensive data visualisation solution capable of transforming raw data into structured, accessible, and actionable reports.

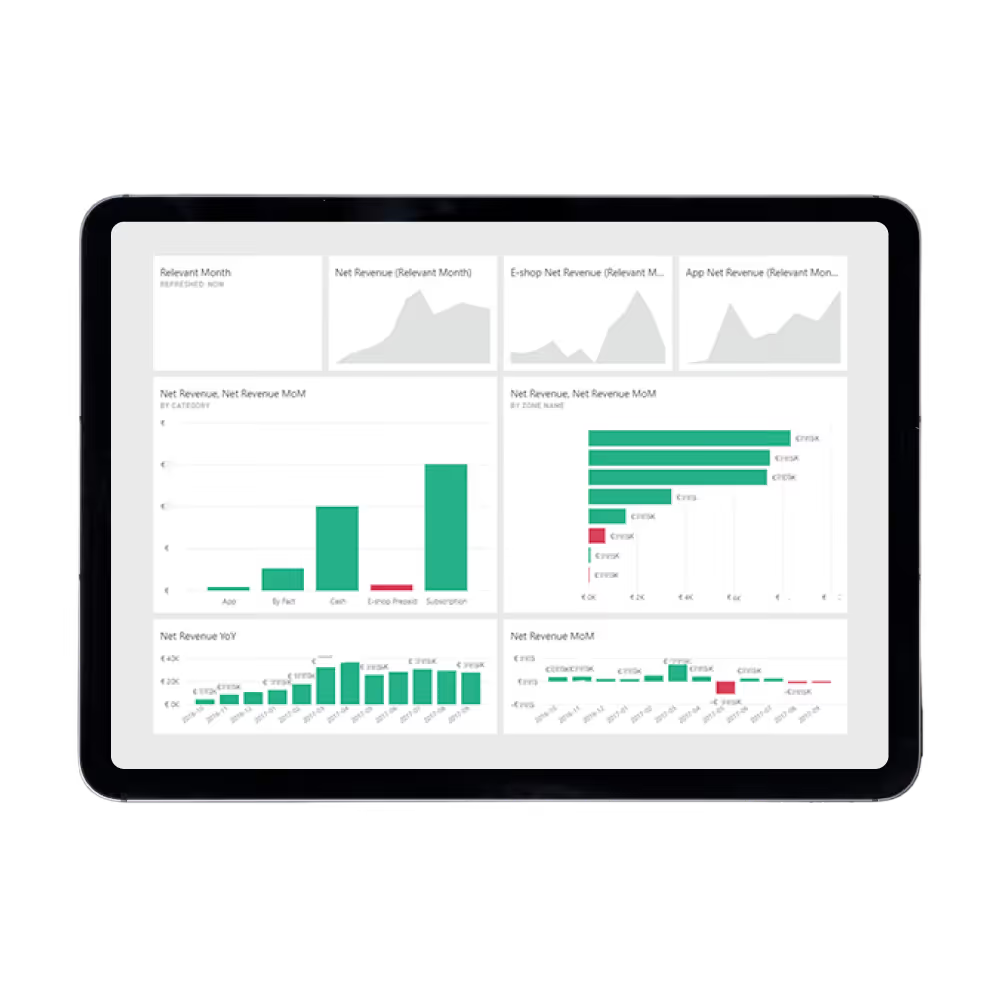
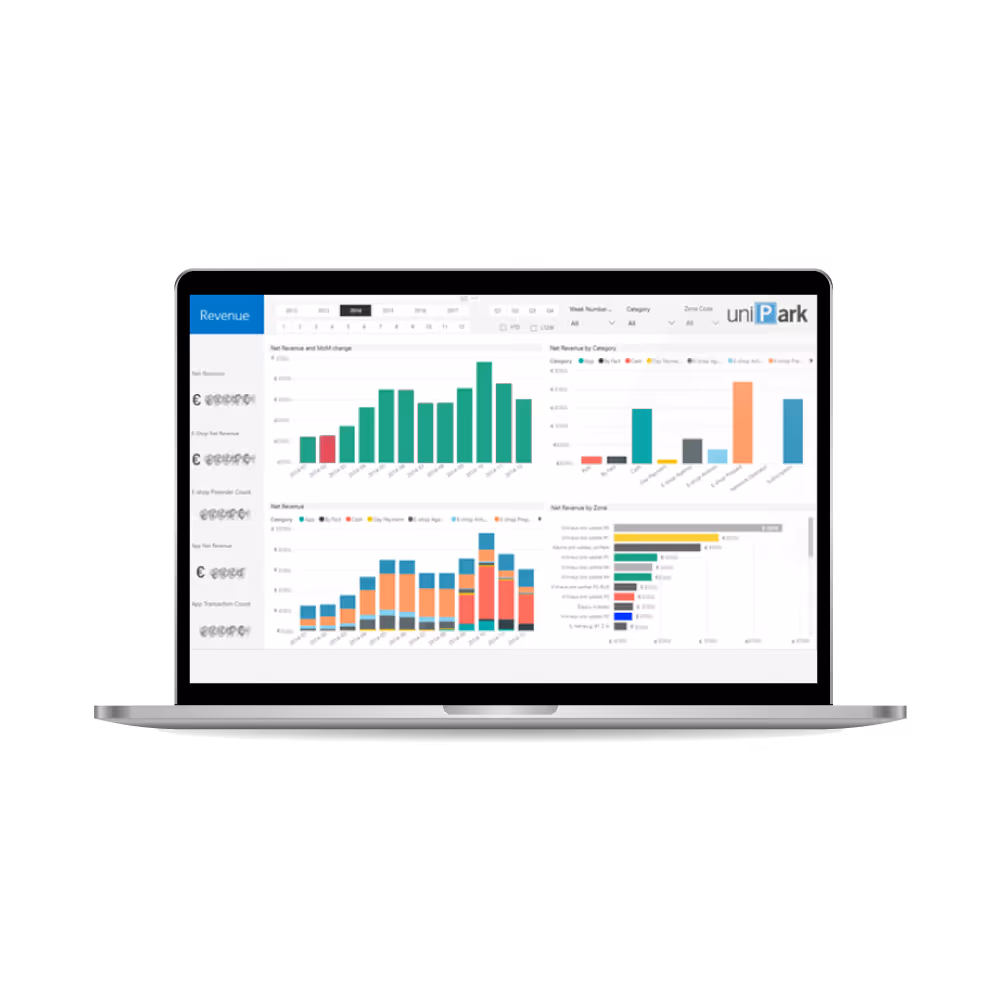
Following a detailed analysis of the client’s requirements, Baltic Amadeus developed a data visualisation solution based on Microsoft Power BI. The project included the creation of a structured dashboard and report hierarchy designed to provide both high-level overviews and detailed analytical capabilities.
The main dashboard view presents a consolidated summary of key performance indicators for selected periods. From this overview, users can navigate to more detailed reports when unusual patterns or areas of interest are identified.
The reporting structure allows data to be segmented across multiple dimensions, enabling deeper exploration and comparative analysis. Colour-coded periodic comparisons were introduced to accelerate interpretation and significantly reduce the time required to make informed decisions.
The implemented Business Intelligence solution streamlined the reporting process, reducing the time spent preparing manual reports, and allowing employees to focus on higher-value analytical activities. This shift increased overall productivity and enabled more strategic use of organisational resources.
In addition, the Power BI platform provides enhanced visibility into customer behaviour and operational performance. These insights support improved understanding of customer needs and preferences, helping the company refine its service offering and strengthen its customer engagement strategy.
By introducing structured, visually intuitive reporting, the organisation is now better equipped to make faster, data-driven decisions and sustain long-term operational efficiency.


.avif)